The wind is a highly variable resource. In the time domain, there are gusts acting over seconds, calm periods lasting for days, seasonal patterns across the year and climatic influences leading to interannual variation. In the spatial domain, trees cause very localised shelter effects, gentle hills can funnel the wind smoothly around them and continental land masses slow down the winds that whip across the ocean. Consequently, assessing the wind resource is not easy.
The power available in the wind is derived from the kinetic energy available in a stream tube passing through a given area (Gipe, 2004). The most important part of wind resource assessment is the fact that the available power is proportional to the cube of the wind speed:
P = power available (W) ρ = density of air (kg/m3: approx. 1.2kg/m3 at sea level & 15°C) A = swept area of wind energy conversion device (m2: = πr2 for conventional horizontal axis rotors) V = wind velocity (m/s)
This cubic relationship is the single most important point relating to the assessment of the wind resource, as a doubling of the wind speed yields an eight-fold increase in power! As a result, an accurate assessment of the wind resource at each proposed site is absolutely vital (much more so than for solar, where the power produced is linearly proportional to the resource), as even a relatively small difference in the resource can make or break a project.
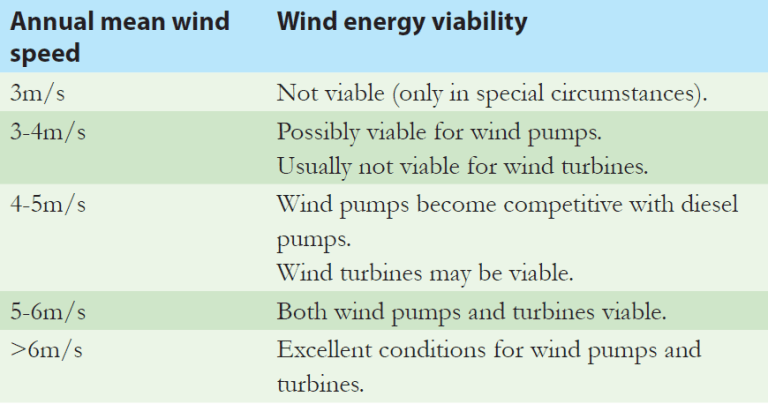
Viability of wind energy in various conditions. Please note that these are not the only conditions for viability and should be used only as a guide. Adapted from Practical Action’s iRET (2011a)
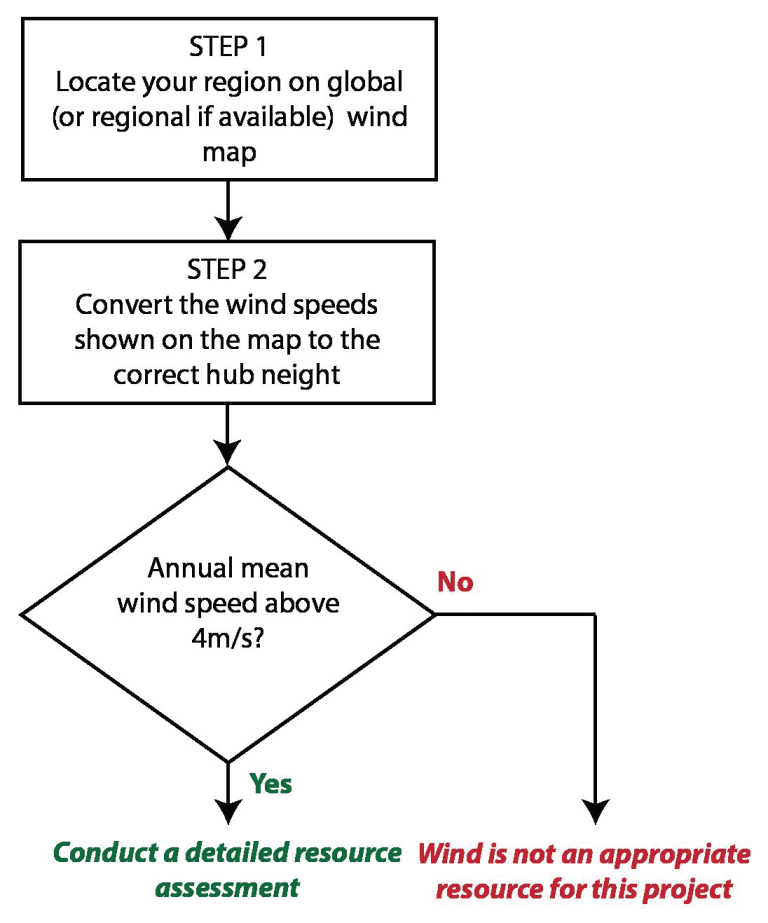
However, a full resource assessment can cost tens of thousands of pounds and take at least one year, which often only makes economic sense for utility scale wind farms. The following step-by-step guide will take you through the process of assessing the wind resource at a given site using a variety of methodologies, from simplest and cheapest through to the most accurate and reliable. The figure below gives an idea of how much wind is needed in order to extract a useful amount of power. The flow chart below shows the key steps in conducting a basic wind resource assessment. If the result of this process is positive, it can then be extended to a detailed wind resource assessment using the process shown in LINK.
Overview of the basic wind resource assessment process
Previous operating experience
The methodology described in this section is for assessing the wind resource in a new location. If there is already a small wind turbine operating at a neighbouring building and there are no major differences between the two sites (in terms of topography, vegetation, buildings or other obstacles that may funnel the wind or shelter the site), then recording actual energy yields from the original turbine is the easiest way of obtaining a reliable wind resource assessment. If the same model of turbine is to be used, it can even be more accurate than using an anemometer and data logger, as many factors such as wind shear (vertical wind speed profiles that result from complex topography or obstacles) and turbulence (fluctuations in wind speed in the time domain) can affect actual energy yields.
Interpreting wind maps
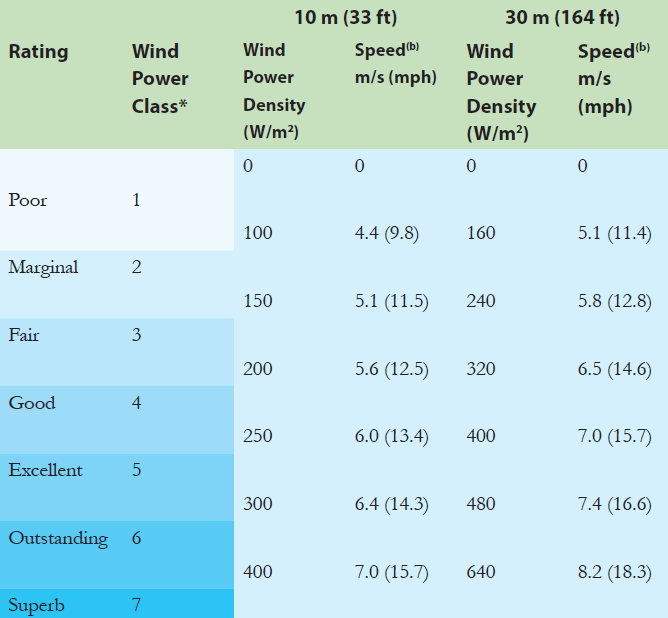
Wind maps are often coloured by ‘wind power classes’ instead of mean annual wind speeds. It is important to know that the wind speeds that these relate to depend on the reference height: the table below shows the definitions of wind power classes for 10 m and 30 m hub heights.
Wind power class definitions. Mean wind speeds are based on the Rayleigh speed distribution of equivalent wind power density at standard sea-level conditions (NREL, 1986). The Rayleigh wind speed distribution is the industry standard assumption, however due to the unpredictability of the wind resource, it is never actually exactly replicated in real life. See The Danish Wind Energy Association (2014) for more details.
The global wind map shown below should help you first of all decide whether your potential site has any wind resource at all; for example, if you are in the Amazon, Democratic Republic of Congo or Borneo, wind is obviously not the right technology.
For on the fly calculations, it is important to know:
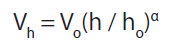
Wind speed increases with height above ground and as the wind map above refers to wind speeds at altitudes of 80 m (much higher than typical hub heights (wind turbine heights are usually specified by the height of the hub above ground level, i.e. the centre of the blades) of a small wind energy conversion device, which are typically 6–30m), the values shown need to be adjusted using the following equation (Suvire, 2011):
Vh = Vo(h / ho)α Vh = wind speed at hub height, h (m/s) Vo = wind speed at a reference height, ho (m/s) h = hub height of wind energy conversion device (m) ho = reference height (m) α = friction coefficient
The diagram below shows that buildings and trees slow the wind at ground level down much more than open water or flat ground. The friction coefficient, α, is used to model this effect:
The effect of different landscapes types (different surface roughness) on the wind velocity near the ground
As a general rule of thumb, any sites with an annual mean wind speed below 4 m/s are unlikely to be economic for small scale power generation. Therefore, as a rough estimation (assuming α = 0.2 and a very high 30 m tower) any regions shown in the global wind map above with an annual mean wind speed of 5 m/s or lower are generally poor candidates for wind energy conversion technologies. Various companies, such as 3Tier (2011) and New Roots Energy (2013) offer the ability to use a GPS coordinate to pinpoint your exact location in their global datasets and receive detailed predictions of the wind resource. However, it is important to realize that these are just predictions. They do not take account of sheltereffects from trees, nearby buildings etc. and often provide inaccurate data for more remote areas.
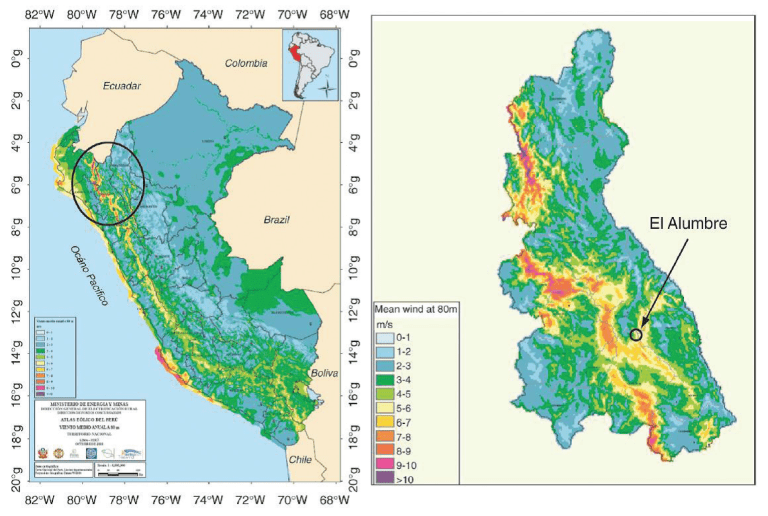
National and even regional wind maps, such as the Peruvian wind atlas shown in Figure 18 are also often available and offer much higher resolution than the global wind map in Figure 16. Again, they must be used with caution as wind maps are produced by measuring wind speeds at specific locations with an anemometer/data logger and using computer modelling (sometimes supplemented by satellite data that tracks cloud movements) to join up the dots by inter- and extrapolation. The accuracy of the resulting wind map is dependent on the number of locations at which the wind was measured, the quality and duration of the measurements and the effectiveness of the computer algorithm used to tie it all together.
80 m wind map of Peru, with detail of the municipality of Cajamarca. Image adapted from Ferrer-Martí et al., (2010), original data from Meteosim Truewind S.L. Latin Bridge Business S.A., (2008)
As a result, each wind map is slightly different and none is 100% correct, so it is important to draw from as many sources as possible. The International Renewable Energy Agency (IRENA) has created an extremely useful freely available tool, which overlays many of the best global wind maps (together with solar resource, population density, electricity grids and much more) onto Google Maps (IRENA, 2013). This enables you to easily compare between the different wind maps that are available in your location. If they all agree that there is good wind in a particular place, then it gives you much more confidence that there will be good sites in that region.
References
3TIER (2010) Global Wind, Solar and Hydro Resource Maps. Available from http://www.3tier.com/en/support/resource-maps/ [Accessed: 3rd March 2014].
Danish Wind Energy Association. (2014) Wind know-how [Online] Available at http://www.motiva.fi/myllarin_tuulivoima/windpower%20web/en/tour/wres/index.htm [Accessed: 24th February 2014].
Ferrer-Martí, L., A. Garwood, J. Chiroque, R. Escobar, J. Coello and M. Castro (2010). A Community Small-Scale Wind Generation Project in Peru. Wind Engineering. 34 (3). pp.277–288.
Gipe, P. (2004) Wind Power: Renewable Energy for Home, Farm, and Business. Vermont: Chelsea Green Publishing Co, White River Junction.
IRENA (2013) Global Atlas for Renewable Energy [Online] Available at: http://irena.masdar.ac.ae/.
Meteosim Truewind S. L., Latin Bridge Business S. A. (2008) Atlas Eólico del Perú. [Online] Available at http://dger.minem.gob.pe/atlaseolico/PeruViento.html [Accessed: 3rd March 2014].
New Roots Energy: Wind Report. New Roots Energy (2013) [Online] Available from http://www.newrootsenergy.com/ [Accessed: 3rd March 2014].
NREL (1986) Wind Energy Resource Atlas of the United States. [Online] Available from http://rredc.nrel.gov/wind/pubs/atlas/tables/1-1T.html [Accessed: 3rd March 2014].
Suvire, G. O., (ed.) (2011) Wind Farm – Technical Regulations, Potential Estimation and Siting Assessment, InTech publishing [Open access book].